
Mervis Analytics
Our R&D team focuses on analysis of process data, mainly HVAC and energy data. We offer out of box solutions as well as customized solutions. We use SkySpark for online data analysis. See example of detected faults in SkySpark below.
We do have a complex set of tools for HVAC data analysis that were developed in cooperation with The University Centre for Energy Efficient Buildings of the Czech Technical University in Prague.
Mervis fault detection and diagnosis tools (MFDD) – Ultimate tools for monitoring based commissioning
Do you already have monitoring based commissioning in your building?
There are operational faults in every building, and this also applies to the yours one. Operating faults cause increased energy consumption, reduced comfort or shortened technology life, and also occur in well-operated buildings. Various studies, as well as our own experience shows that savings potential amounts to 5-50 % of energy costs. monitoring based commissioning is an effective way of checking the work of maintenance workers and service companies, which detects those faults, helps to fix them and confirms their successful elimination.
Are you sure that your technologies are in great condition, the staff is careful, knowledgeable and regularly monitors it, and besides, you know exactly what they are doing? No? Then call us, we are here to help you!
How does it work?
MFDD is an expert system focused on buildings and their technologies. It works with operational data from the Building Management System (BMS), analyzes them using detection rules and graphically presents the results. If operational faults are found in the building, it will show their occurrence over time, a description of the fault and evaluate the severity. This guard watches over your building constantly, even when you're looking elsewhere.
Unlike other tools, MFDD solves data analysis comprehensively in three key points:
Connection of operating data from the building
MFDD works on a cloud architecture and can read operational data from your building directly from your Building management System (BMS). Like any expert system, it needs not only data itself, but also their machine-readable meaning. It uses semantic description for this. If your data has a semantic description, we can use it and connect your data to an expert system. If not, we will create it. When working with semantic data, we follow global trends in the Brick and Haystack 4.0 initiatives, which allows us to work with data from thousands of buildings in a unified way.
The semantic description is created only once, at the beginning of continuous commisioning. Once created, it is possible to analyze both historical data and run analysis of current data on a regular basis.
Fault detection
For fault detection, the software contains dozens of expert rules developed by us, which are focused on heating and air conditioning. Unlike fault messages concerning, for example, a clogged filter, which are common in SCADA systems and concluded from a single signal, MFDD handles faults much more comprehensively. The rules detect, for example, simultaneous heating and cooling, operation outside normal working hours, underheating of heating circuits, insufficient output of heat sources, a situation where the heating circuit requires heat but no heat source is in operation, and much more.
Clear interface for output of results and their interpretation
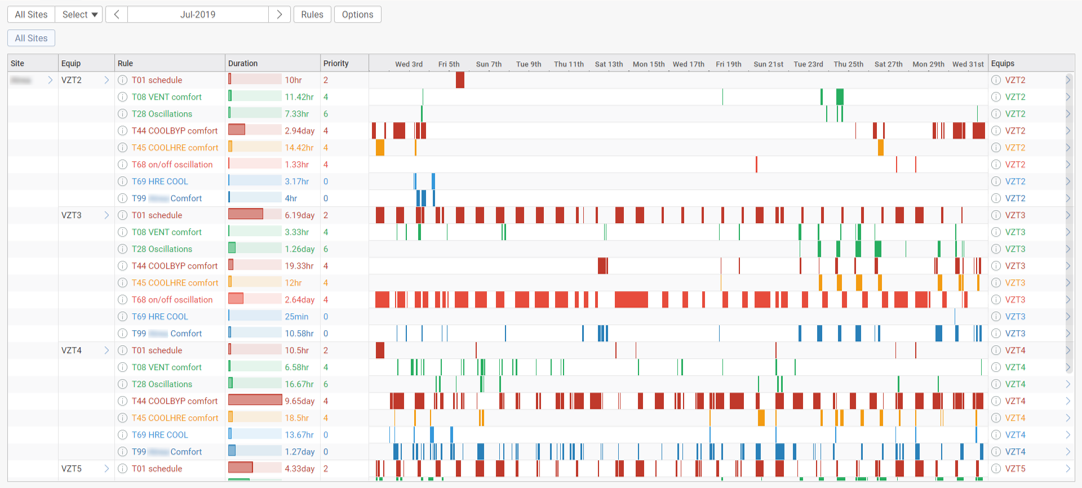
MFDD also includes a clear graphical interface for the presentation of results (Fig. 1). The overview panel shows the results of many rules, evaluated over many technologies over a period of time so that the time dimension is visible. For each fault, a verbal description is available, as well as a graphical representation of the data from which it was detected. So, for example, if we see that underheating of the heating circuit occurs every morning, with a single click we can display the time course of the desired temperature, actual temperature, valve opening, boiler temperature and other contextual data to help understand of what is actually happening.
The way to detect and correct operational faults has never been easier! Don't you believe? Take a look in our gallery. There are some incidents we've already caught.
Mervis fault detection and diagnosis tools were developed in TAČR – FaDeDiS project.
Air handling units fault detection and diagnosis
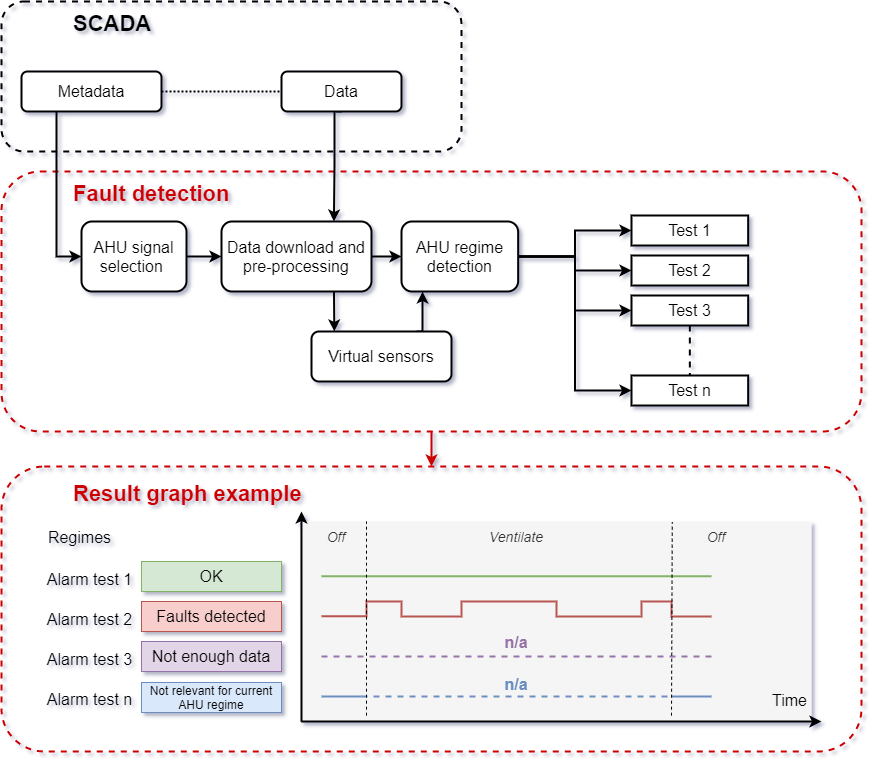
We provide a versatile tool for air handling units (AHU) fault detection and diagnosis. It works with well sensored AHUs as well as with less equipped AHUs. Almost fifty diagnostic rules are implemented. From simple rules such as "fan on & closed damper" (yes even such basic functionality could go wrong) to more advanced such as "heating and cooling cycling" to advanced rules that make use of laws of thermodynamics for heat recovery operation evaluation. Below is a simplified scheme of AHU fault detection and diagnosis.
See case studies in our gallery
Heating and cooling systems detection and diagnosis
There are many faults that can occure in a heating or cooling system. From simple ones such as "valve saturation & under-heating" to complex ones when you need to take into account topology of a heating system. We implemented set of rules that help to efficiently identify these faults. These rules work well for a single building, however, the major impact is in the case of a bigger building portfolio or district heating systems.
See case studies in our gallery
Energy Twin
Energy Twin is a machine learning tool for the analysis of energy consumption data. It is used for:
- Anomaly detection
- Slow degradation detection
- Setback evaluation
- Energy consumption benchmark
- Alternative scenarios simulation
- Reporting
There are two ussage scenarios:
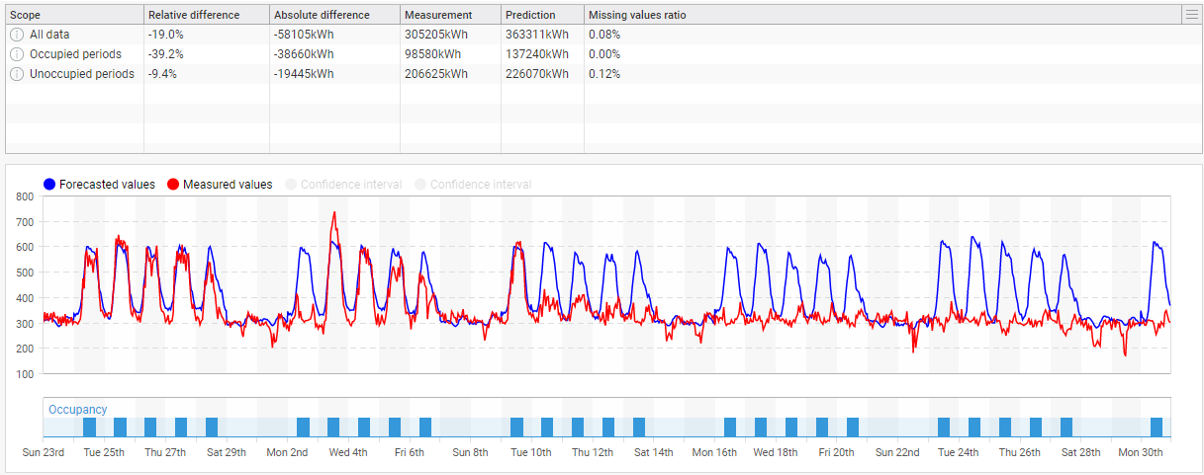
- Offline analysis - send us your data with 15 minutes (or less) sampling period and we will process it and provide you valuable feedback. See the standardized Energy Twin report.
- Online analysis - connect you measurement to Mervis SCADA. Energy Twin then can detect anomlies in real time (deviation of measurement and prediction) and help optimize energy cosumtion.
Indoor air quality assessment tools
Evaluation of indoor air quality (IAQ) could be a challenging task especially when there are hundreds of IAQ sensors in a building. However, with the right tools, one could take the holistic approach and ask questions such as
- Is there a correlation between floor and IAQ?
- Is there a difference in average indoor temperature on the south and north facade?
- Is there a temperature setback out of office hours?
We do provide a set of tools and report specialized on IAQ suitable especially for the evaluation of a large IAQ sensor sets.
Are you interested in using some of these tools?
We are looking for strategic partners - ESCO (EPC, FM, etc) companies that can exploit the potential for optimization hidden in their data using our analytical tools. Are you interested? Contact us, we will show you a live demo of our tools.
Do you want to analyze data from your building? We can have a look or contact you with some of our partners.
Custom analytic tools
Our R&D can provide tailored analytical tools for your technolgoy.
- Custom dashboards
- Regular or event triggered reports to your email
- Custom fault detection algoritms
- custom benchmarks and KPIs
See our case studies
Do you have a specific task that cannot be fulfilled by standard means (PLC, SCADA)? We can provide you a solution.