
Full-Featured Graphs in the Mobile App
The Mervis SCADA mobile app brings the powerful data visualization of our desktop website directly to your pocket. You can view and interact with full-featured graphs seamlessly within the application. The app fully supports both portrait and landscape orientations, automatically adjusting to give you the best view of your data.
Available Graph Types
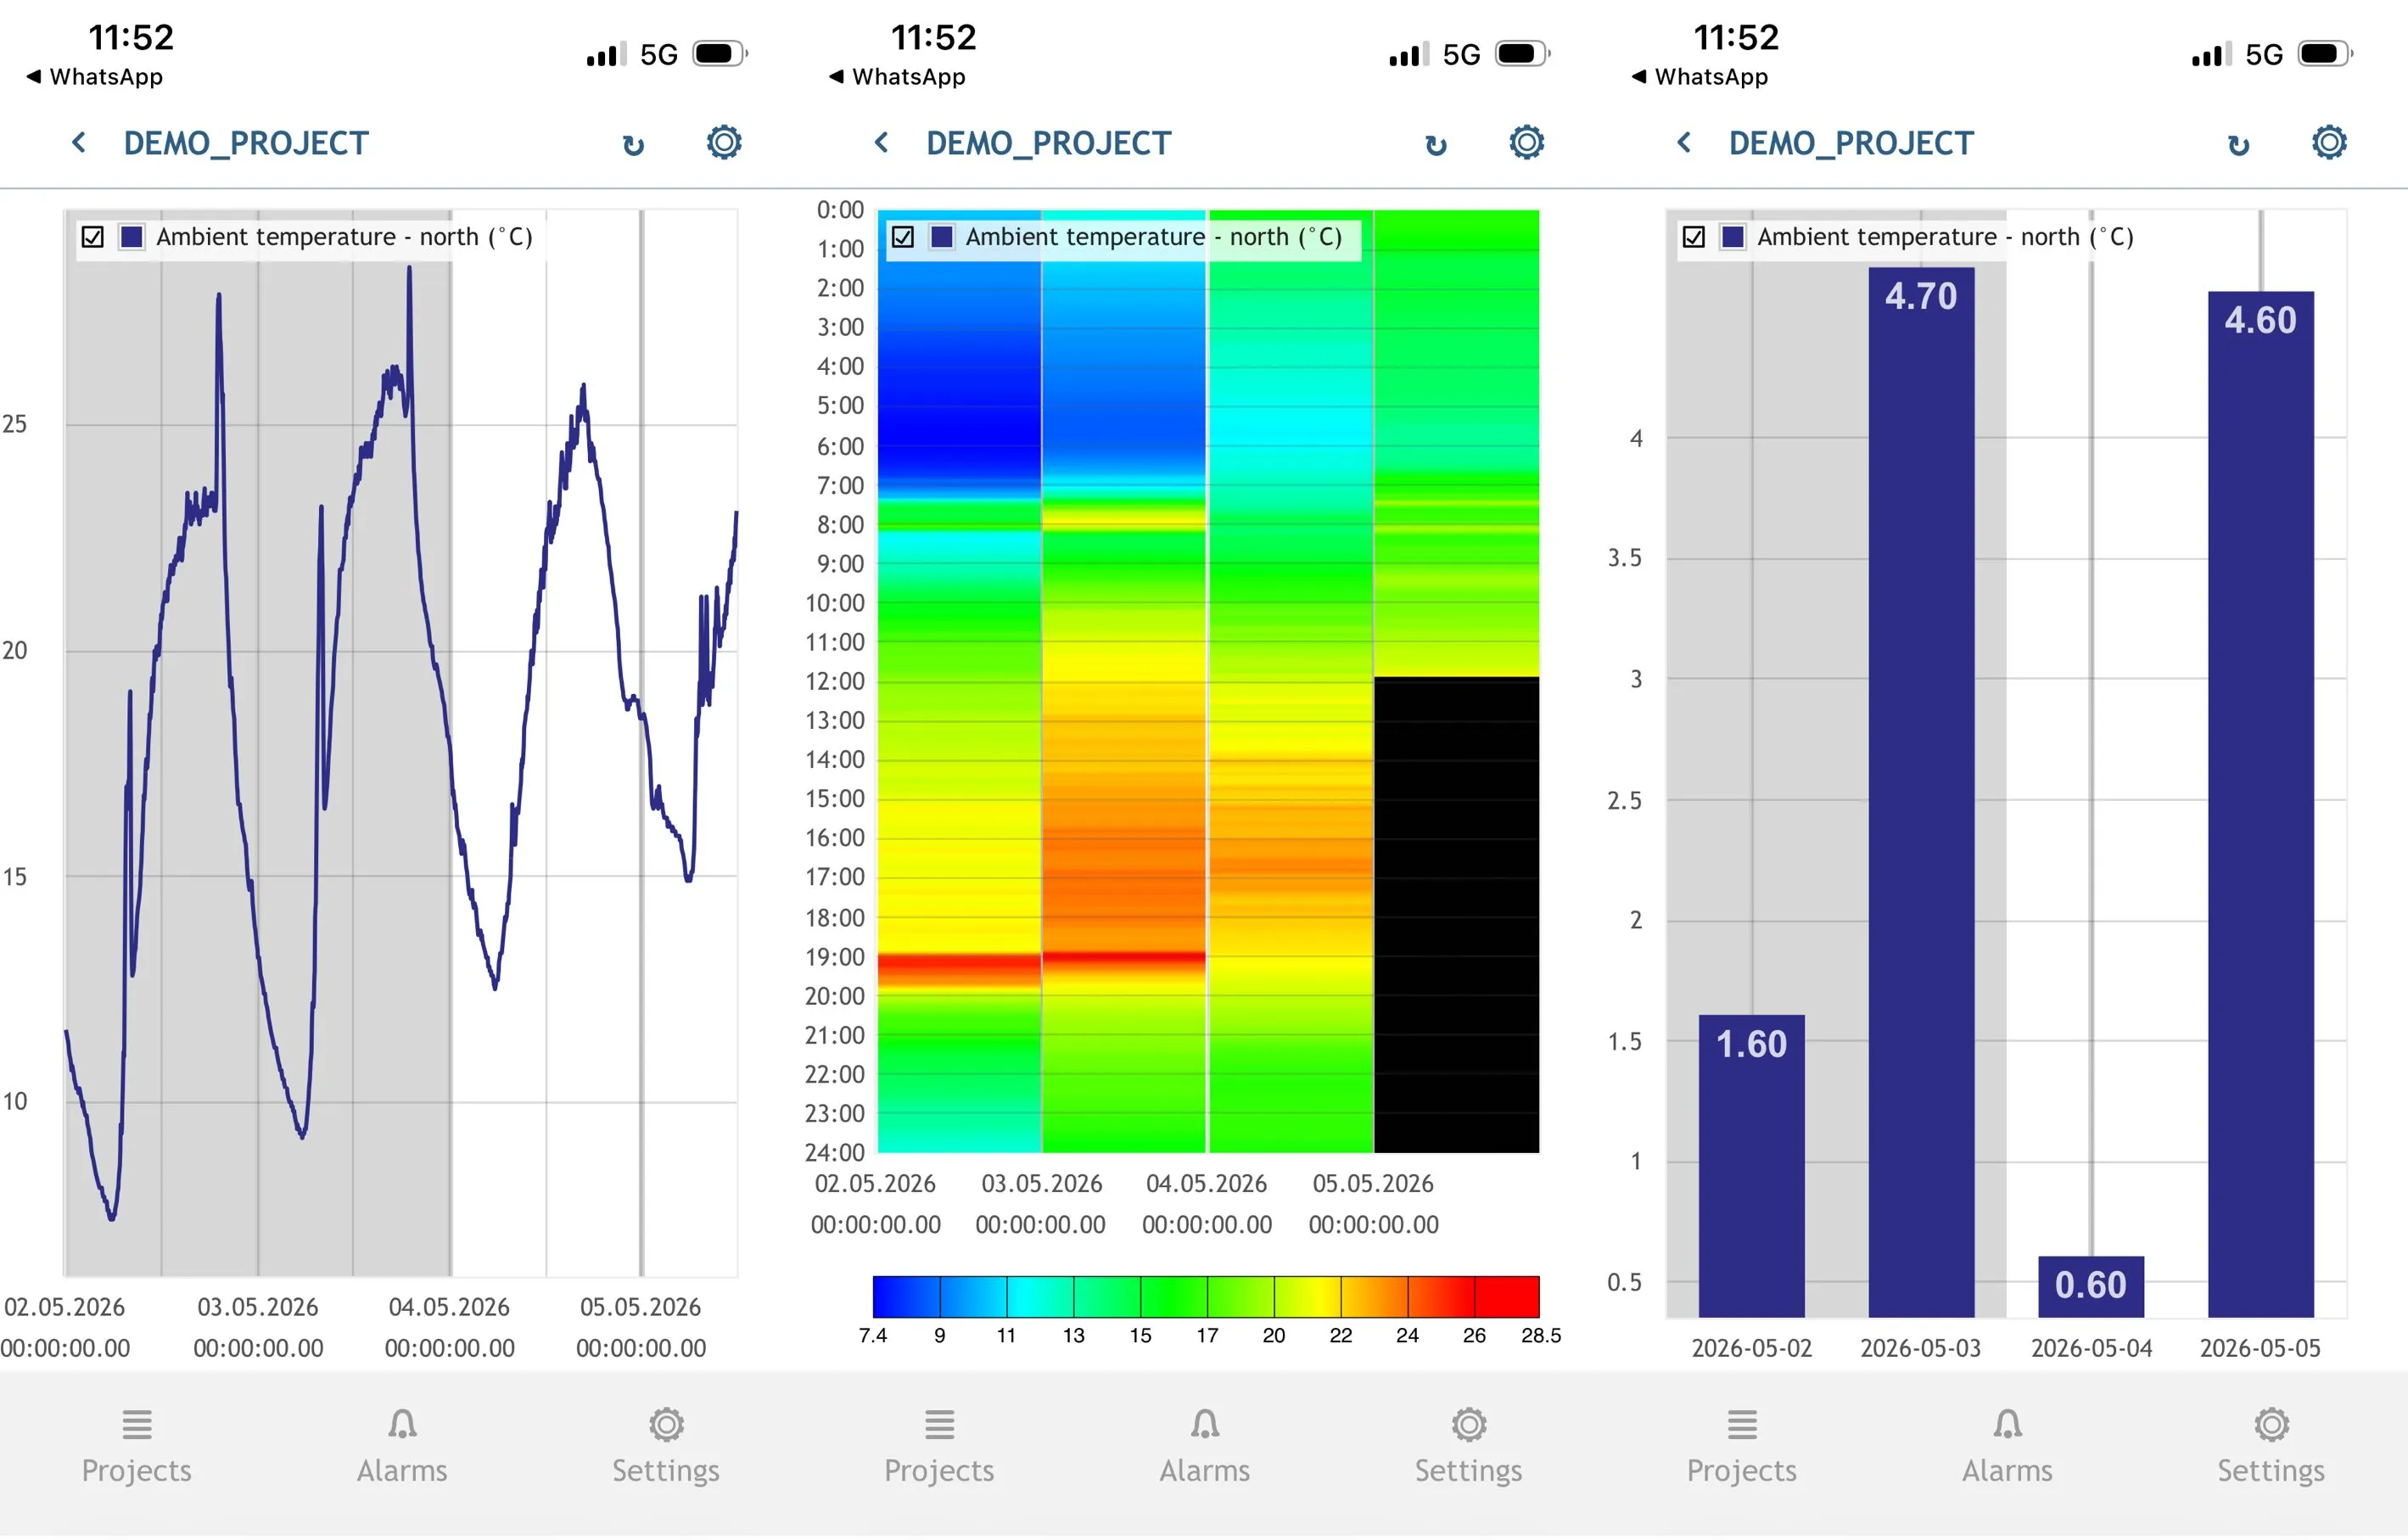
- Line Graphs: Perfect for tracking continuous data trends and identifying fluctuations over time (such as temperature changes).
- Bar Graphs: Ideal for comparing distinct data sets, viewing totals, or analyzing historical averages side-by-side.
- Carpet Graphs: Act as heatmaps. They are excellent for visualizing data density and spotting complex patterns across specific times of day over a longer period.
How to Access
To access these features, simply locate your datapoint, touch and hold the row until it turns green, and tap the blue graph icon that appears in the bottom right corner.
Helpful Links & Resources
- Technical Documentation: Mobile Application Setup & Graph Settings