
Contextualizing Performance with Live Weather Data
How do you prove your HVAC system is actually operating efficiently? You overlay its performance against the weather.
Analyzing building energy consumption in a vacuum doesn't give you the full picture. A sudden spike in heating power might look like a systemic fault, until you see the corresponding drop in outdoor temperature. Context is everything in building analytics.
To provide immediate diagnostic clarity, Mervis SCADA includes a native Weather Data integration built directly into the graphing interface.
What this means for facility diagnostics:
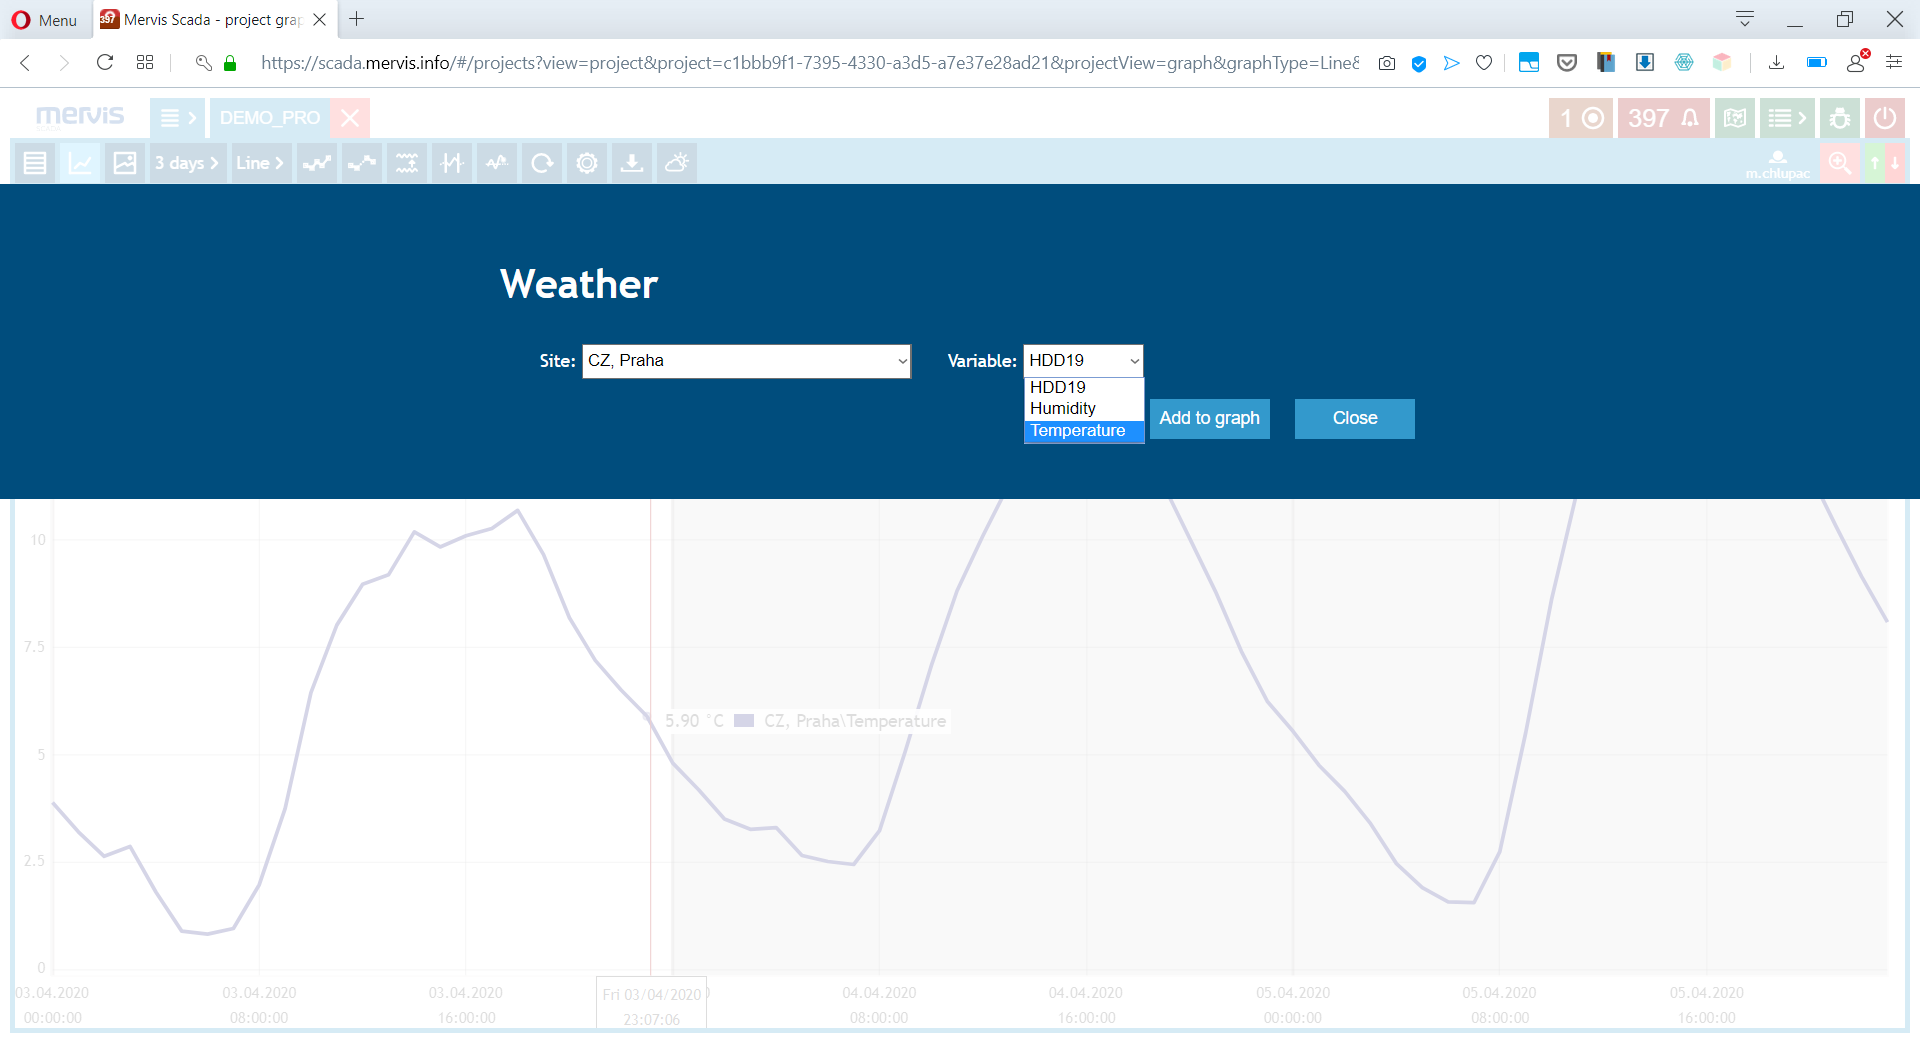
- Instant Overlays: Click the weather icon
 in your graph view to instantly plot predefined weather data points from over 200 geographic locations.
 - Unified Axis: Plot outdoor temperature or humidity on the exact same timeline as your live building telemetry.
- Visual Proof: Quickly contextualize data to prove to stakeholders that the control logic is responding correctly to environmental shifts.
Stop guessing why a system spiked. Look at the weather.
Helpful Links & Resources
- Documentation & Setup: Weather Data Integration Guide (Knowledge Base)