
New Graph Template Controls in Mervis SCADA
At Energocentrum Plus, we're always refining the tools that make daily monitoring faster for our users. The latest Mervis SCADA update adds a dedicated Template section to the graph settings panel, giving advanced users a faster way to standardize how trend graphs look and behave — without re-configuring colors, scales, and series styling on every graph individually.
Save Once, Reuse Everywhere
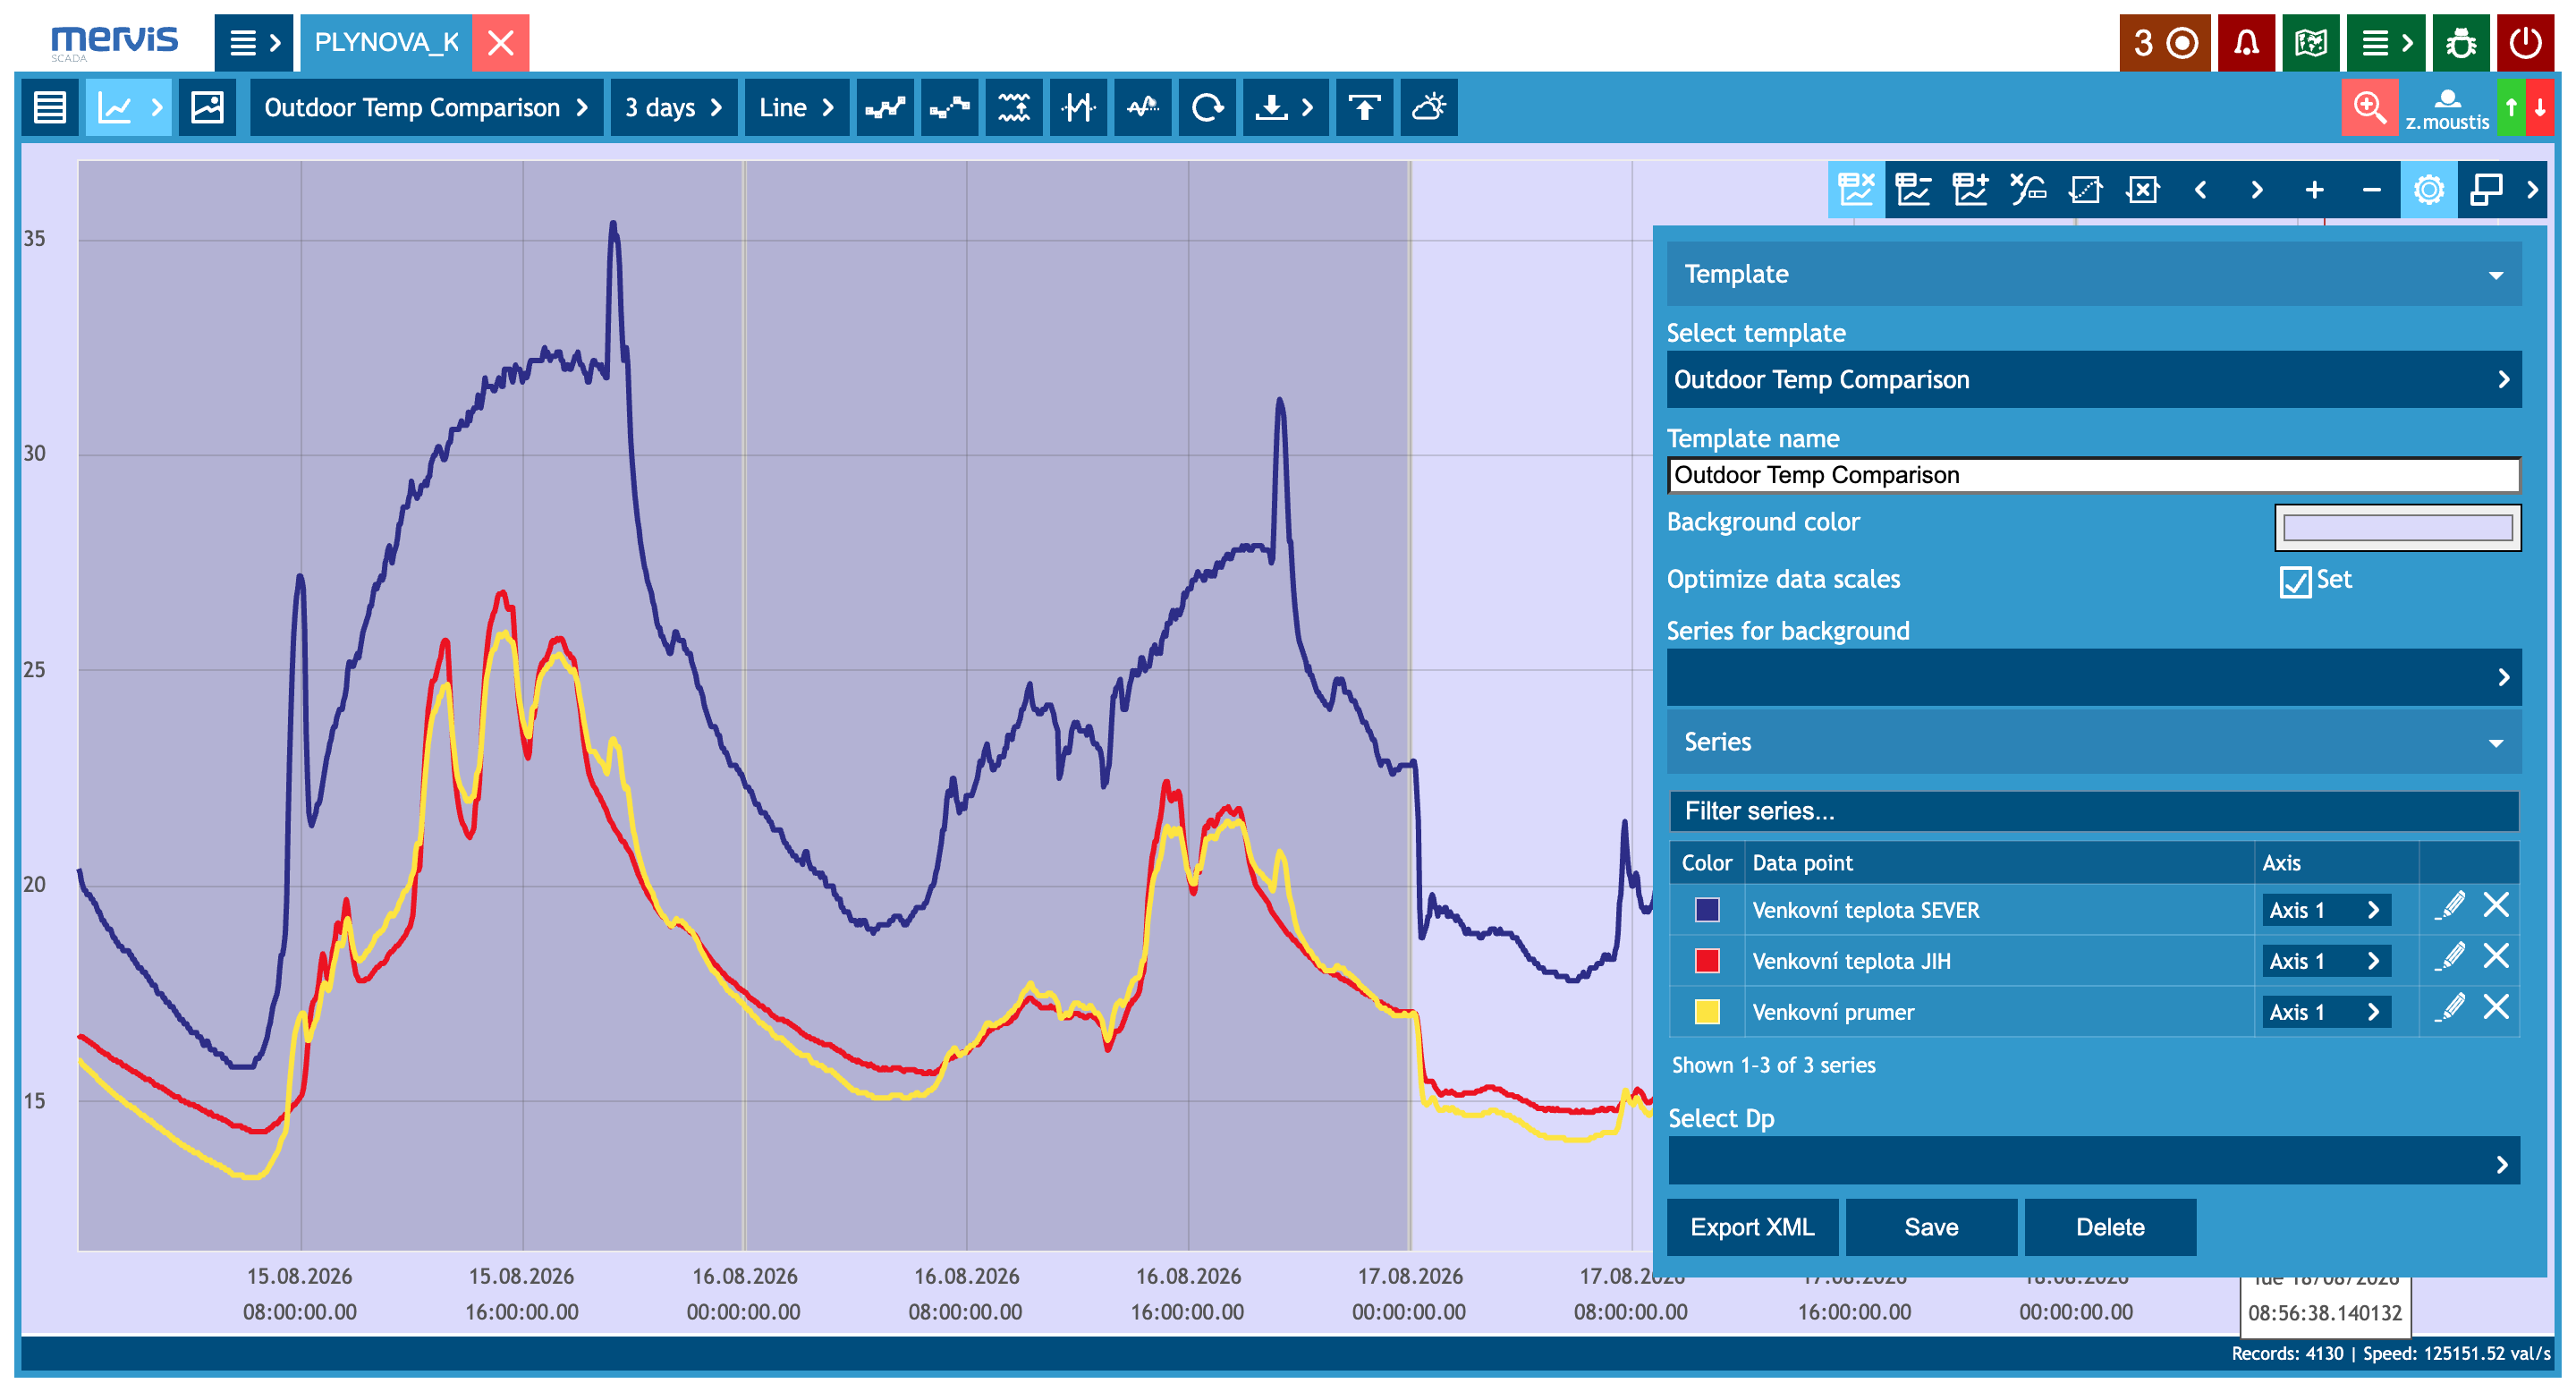
The graph above shows a saved template named Outdoor Temp Comparison, applied to a trend graph plotting three related outdoor temperature series. The template captures the graph's full configuration — a custom background color, automatic axis scaling, and consistent series styling — and makes it available for reuse on any other graph, all from a single settings panel.
Why It Matters for Advanced Users
- Standardize once, apply everywhere: Save a graph's color scheme, background, and scaling behavior as a named template, then reuse it on other graphs instead of manually rebuilding the look each time.
- Faster dashboard setup: New graphs can start from an existing template rather than default settings.
- Configuration portability: An Export XML option lets you back up or transfer a graph's full configuration.
Want the full step-by-step walkthrough, including where to find the settings panel and how to apply a saved template to a new graph? Check out the detailed guide on our Knowledge Base: Graph Templates in Mervis SCADA.