
Column Charts Now Available in IDE Schemas
At Energocentrum Plus, we're always expanding the visualization options available to Mervis IDE users. As of IDE version 2.7.18, the Chart gadget in HMI schemas now supports Bar charts alongside the existing Line chart type — giving you a clearer way to display aggregated or interval-based data directly on the canvas.
Here's what it looks like in a real production schema, tracking daily energy consumption across several pieces of equipment:
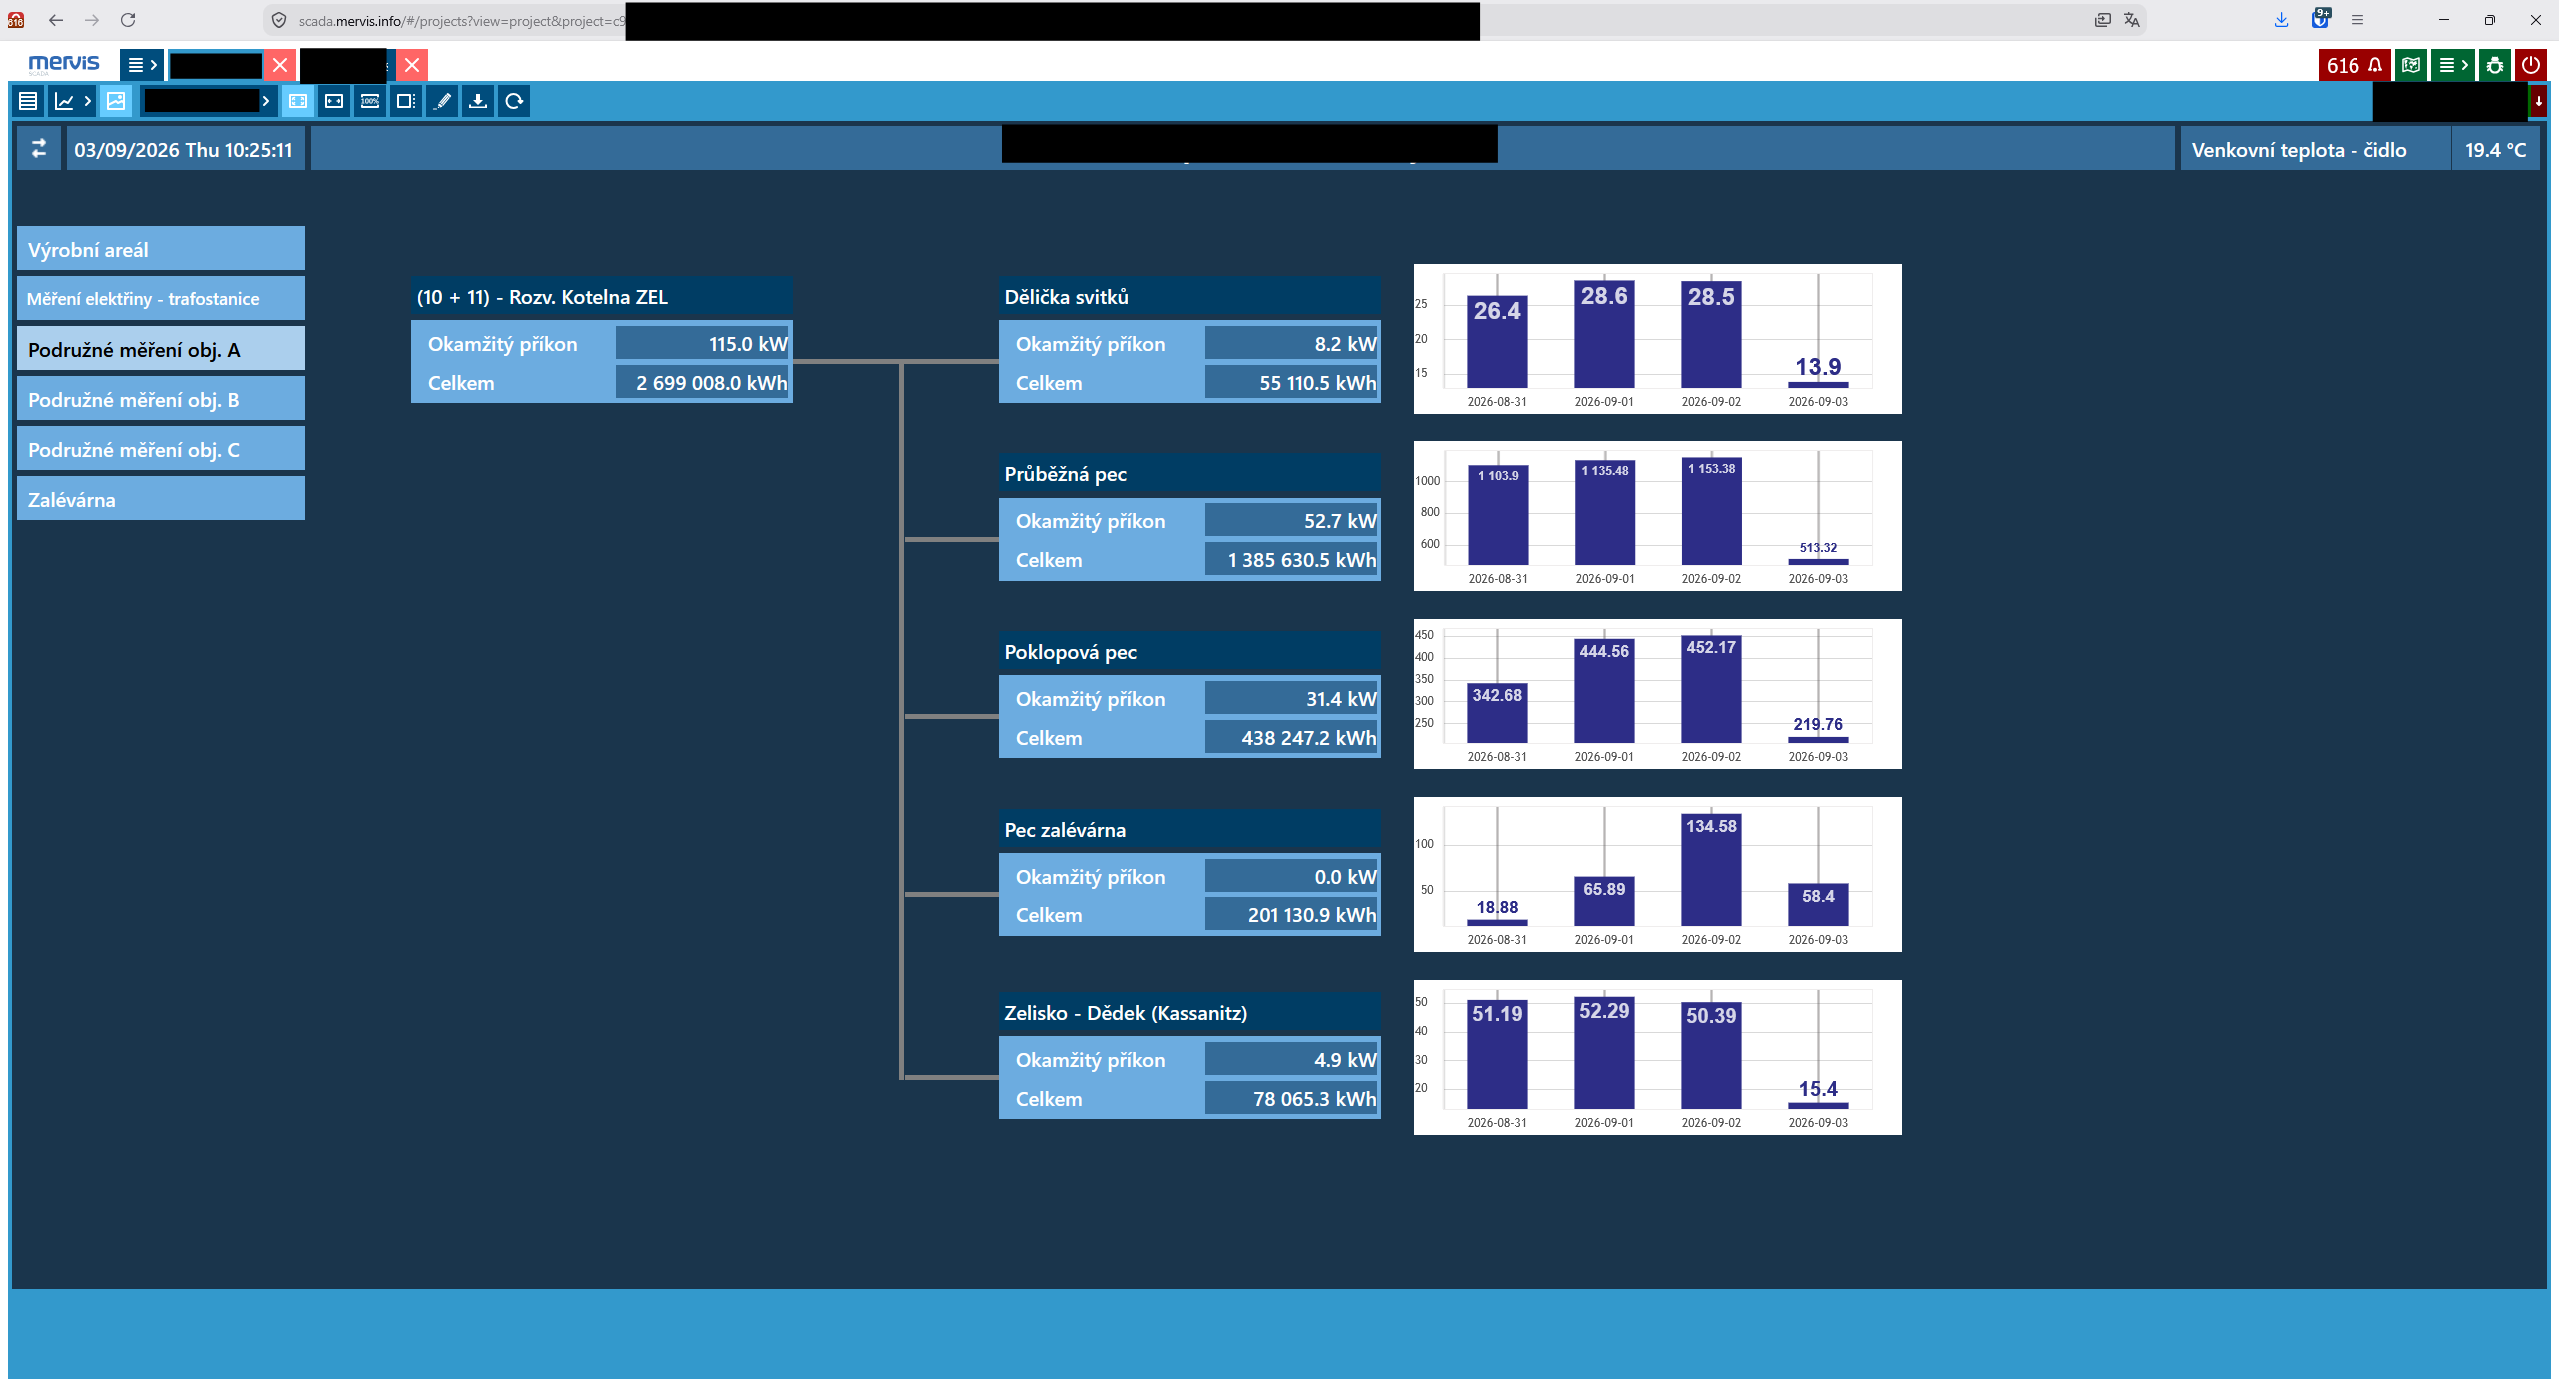
Each panel on the right shows a separate bar chart, one per piece of equipment, with a bar for each day's total. At a glance, an operator can compare daily consumption across the kiln, the divider, the sealing furnace, and more — something that would be much harder to read at this density with overlapping line charts.
Setting It Up
From the HMI Gadget Explorer, drag a Chart object from Graphic Gadgets onto your schema canvas. In the Properties panel, set the Type field to Bar. Two new properties appear specifically for this chart type:
- Bar Interval: Sets the time interval each bar represents (e.g. Day, Hour).
- Bar Data Count Type: Determines how values within each interval are aggregated (e.g. Sum, Minimum in Interval).
Why It Matters
- Better fit for aggregated data: Bar charts are often clearer than line charts for values like daily totals, hourly minimums, or maximums — especially when comparing several data points side by side.
- Built-in aggregation control: Bar Interval and Bar Data Count Type let you define exactly how data is summarized per bar, without extra logic.
- No extra setup: Existing Chart gadgets in your schemas can switch to Bar at any time from the same Type property.
Make sure you're running IDE version 2.7.18 or later — the Bar chart type isn't available in earlier builds. For the full step-by-step configuration guide, including how to bind data via Chart Mappings, see our Knowledge Base: Adding a Bar Chart to an HMI Schema.